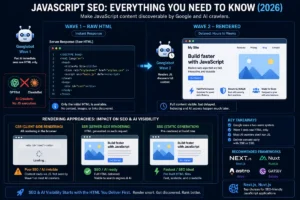
Core Web Vitals are unlike almost every other ranking factor in SEO. They come with specific, published numbers. Good, needs improvement, or poor. There is no ambiguity about whether your site passes or fails. And the consequences of failing are measurable in both rankings and revenue.
Pages loading in under two seconds show a 9% bounce rate. Pages exceeding five seconds show a 38% bounce rate. A one-second delay in load time reduces conversions by 7%. For an e-commerce site generating £100,000 per month, that single second of delay costs approximately £84,000 per year in lost conversions.
The SEO impact is real but secondary to the business case. Pages in position one on Google show a 10% higher Core Web Vitals pass rate than pages in position nine, according to DebugBear research. Moving from “poor” to “good” on all three metrics produces approximately 1 to 2 position improvements in competitive keyword spaces. Across 40 Core Web Vitals optimisation engagements, the average conversion rate lift from moving a site from “poor” to “good” on all three metrics was 11 to 19%. The ranking win matters. The conversion win is often bigger.
This guide covers everything about Core Web Vitals: what they are, how they are measured, what causes each metric to fail, how to fix each one, and how they connect to AI visibility in 2026.
What Are Core Web Vitals?
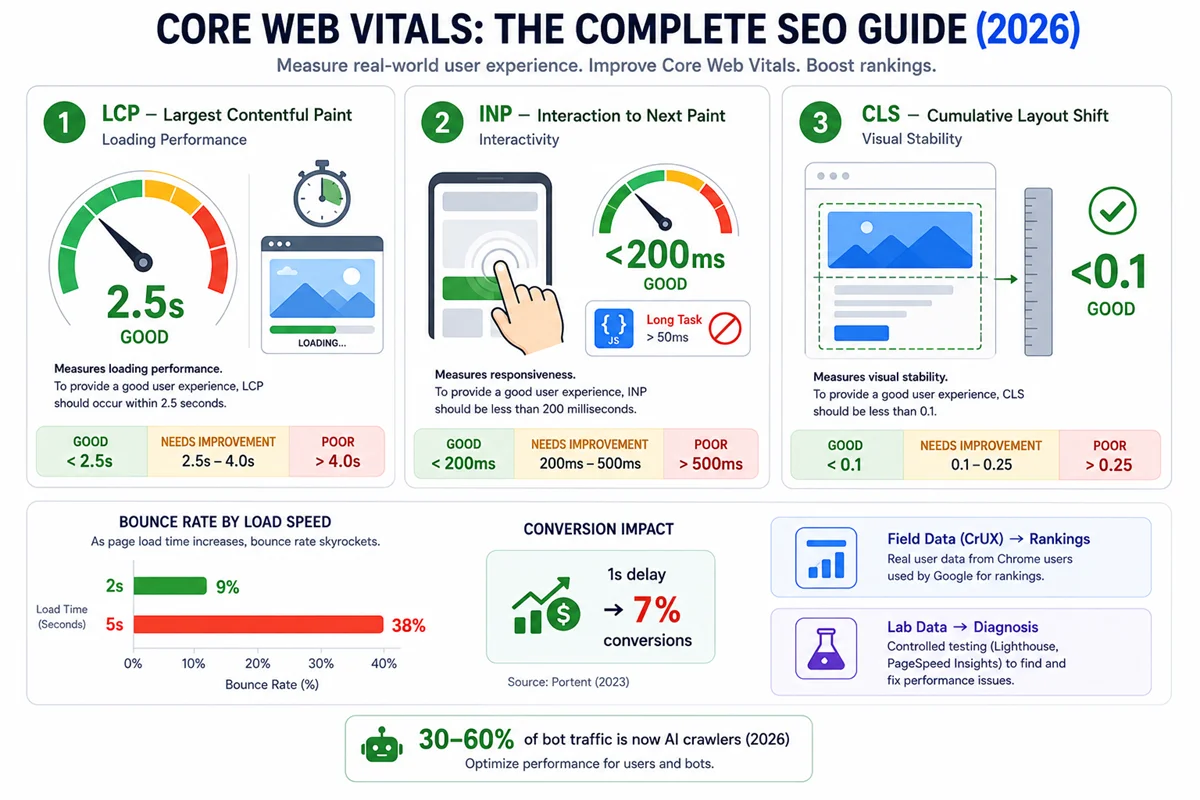
Core Web Vitals — three specific performance metrics Google uses as confirmed ranking signals to evaluate the real-world user experience of loading and using a web page.
They became a confirmed ranking signal as part of Google’s Page Experience update in 2021. In March 2024, INP (Interaction to Next Paint) replaced FID (First Input Delay) as the interactivity metric, completing the current framework.
The three Core Web Vitals are:
- LCP — Largest Contentful Paint (loading performance)
- INP — Interaction to Next Paint (interactivity and responsiveness)
- CLS — Cumulative Layout Shift (visual stability)
Each metric has three performance bands:
| Metric | Good | Needs Improvement | Poor |
|---|---|---|---|
| LCP | Under 2.5 seconds | 2.5 to 4 seconds | Over 4 seconds |
| INP | Under 200 milliseconds | 200 to 500 milliseconds | Over 500 milliseconds |
| CLS | Under 0.1 | 0.1 to 0.25 | Over 0.25 |
Google evaluates Core Web Vitals using field data — measurements from real users accessing your pages on real devices and connections, collected through the Chrome User Experience Report (CrUX). This is the data that affects rankings, not the simulated lab data from tools like Lighthouse.
Why Core Web Vitals Matter for SEO
The Ranking Impact
Google has consistently described Core Web Vitals as a real but not dominant ranking factor. The honest characterisation in 2026 is this: failing Core Web Vitals does not prevent a page from ranking, but it creates a meaningful handicap in competitive keyword spaces where content and authority are otherwise comparable between pages.
Research confirms the practical impact:
- Pages in Google position one show a 10% higher Core Web Vitals pass rate than pages in position nine (DebugBear)
- The ranking improvement from moving from “poor” to “good” on all three metrics is approximately 1 to 2 positions in competitive niches
- Core Web Vitals function most clearly as a tiebreaker: when two pages have similar content quality and authority, the page with better performance tends to rank higher
The inverse also applies: a page with excellent content and strong authority that fails Core Web Vitals will still rank, but below where it would rank with the same content and passing performance scores.
The Business Impact
The conversion and engagement data makes the case for Core Web Vitals optimisation even more compelling than the SEO case:
Bounce rate by load speed:
- Under 2 seconds: 9% bounce rate
- 3 seconds: 18% bounce rate
- 5 seconds: 38% bounce rate
- Each additional second beyond the 2.5-second LCP threshold increases bounce rates by approximately 32%
Conversion impact:
- A 1-second improvement in load time can improve conversions by 7%
- E-commerce sites reaching “good” thresholds on all three Core Web Vitals see 15 to 30% conversion improvements
- Across 40 documented optimisation engagements, moving from “poor” to “good” on all three metrics produced an average 11 to 19% conversion rate lift
For a site generating £100,000 in monthly revenue, a 7% conversion improvement means approximately £84,000 in additional annual revenue. The Core Web Vitals investment case often requires no SEO justification at all.
The AI Visibility Connection
In 2026, Core Web Vitals have an additional dimension: AI search visibility. AI systems including Google AI Overviews, Perplexity, and Bing Copilot prefer to cite sources that are fast, stable, and reliable. A poor user experience reduces the likelihood of an AI system selecting your page as a citation source, because a slow or unstable page reflects poorly on the AI’s recommendation quality.
Fast LCP signals that a page delivers content quickly, a quality signal that AI crawlers associate with high-quality sources. Good CLS signals that the page content is stable and predictable. Good INP signals that the page is responsive to interaction.
This connection between technical performance and AI citation probability is not yet widely documented, but the directional logic is consistent with what we know about how AI systems evaluate source quality.
LCP: Largest Contentful Paint
What LCP Measures
LCP — the time from when a page begins loading to when the largest visible content element on the page has fully rendered.
The “largest contentful element” is typically the hero image, the largest paragraph of text above the fold, or a video thumbnail. Google identifies this element automatically. In most cases for article-style pages, it is the hero image or the largest heading visible before scrolling.
Google’s threshold: LCP under 2.5 seconds is “good.” LCP between 2.5 and 4 seconds “needs improvement.” LCP over 4 seconds is “poor.”
What Causes Poor LCP
Slow server response time (TTFB — Time to First Byte). If the server takes a long time to respond to the initial request, everything downstream is delayed. TTFB is the most upstream bottleneck and affects all metrics, not just LCP. Target TTFB under 600 milliseconds.
Unoptimised images. The LCP element is most commonly an image, and unoptimised images are the most common cause of LCP failures. Large file sizes (images with dimensions or quality exceeding what is needed for the display size), wrong formats (JPEG or PNG where WebP or AVIF would be smaller), and images loaded without preloading are the primary culprits.
Render-blocking resources. JavaScript and CSS files that must fully download and execute before the browser can begin rendering the page delay LCP. Resources in the HTML head that are not critical to the initial render block the page from displaying.
No content delivery network (CDN). Without a CDN, all users load assets from a single origin server. For users geographically distant from the server, the latency adds directly to LCP. A CDN serves assets from edge nodes near the user, dramatically reducing this latency.
Lazy loading applied to the LCP element. Lazy loading defers image loading until they are about to enter the viewport. This is beneficial for below-the-fold images (they do not need to load before the user scrolls to them). However, applying lazy loading to the LCP element — the most important above-the-fold image — deliberately delays the most important content. Never apply lazy loading to the LCP element.
How to Fix LCP
Optimise images:
Convert hero images and large above-the-fold images to WebP or AVIF format. WebP is typically 25 to 35% smaller than JPEG at equivalent quality. AVIF can be 20 to 30% smaller than WebP.
Set explicit width and height attributes on all images. This prevents layout reflow when images load and also helps the browser allocate space before the image arrives.
Size images correctly for their display size. An image displayed at 800 pixels wide does not need to be served at 2000 pixels wide. Use responsive images with srcset to serve appropriately sized versions for different viewport sizes.
Add fetchpriority=”high” to the LCP element. This hint tells the browser to prioritise loading this specific image over other resources.
Improve server response time:
Implement a CDN. Cloudflare, Fastly, and AWS CloudFront are the major options. CDN implementation is the single highest-impact LCP improvement for many sites.
Enable browser caching for static assets. Resources that are already cached by the browser do not need to be downloaded again on return visits.
Upgrade hosting if server response is consistently slow. Shared hosting on resource-constrained servers is frequently a TTFB bottleneck.
Eliminate render-blocking resources:
Defer non-critical JavaScript using the defer or async attribute. JavaScript in the HTML head that is not needed for initial rendering should not block that rendering.
Inline critical CSS — the minimal CSS needed to render the above-the-fold content — directly in the HTML head, eliminating the additional network request for that CSS before the page can begin rendering.
Preload the LCP image:
Add a resource hint in the HTML head: <link rel="preload" as="image" href="hero-image.webp">. This tells the browser to begin downloading the LCP image as early as possible, before it would otherwise encounter it in the DOM.
INP: Interaction to Next Paint
What INP Measures
INP — the time from a user’s interaction (a click, a tap, or a key press) to when the browser visually updates in response.
INP replaced First Input Delay (FID) as the official interactivity Core Web Vital in March 2024. The key difference: FID measured only the delay before processing the first user interaction. INP measures the worst-case responsiveness for all user interactions throughout the entire page session.
This makes INP significantly harder to optimise than FID. A site that responded quickly to the first interaction but sluggishly to subsequent clicks, form inputs, or scrolling events would pass FID but fail INP.
Google’s threshold: INP under 200 milliseconds is “good.” INP between 200 and 500 milliseconds “needs improvement.” INP over 500 milliseconds is “poor.”
What Causes Poor INP
Poor INP is almost always caused by JavaScript executing on the browser’s main thread, preventing the browser from responding to user input until that execution completes.
Long tasks. JavaScript tasks that take more than 50 milliseconds to complete are considered “long tasks” by the browser. During a long task, the browser cannot respond to user input. If a user clicks a button while a long task is running, the browser registers the click but cannot process it until the task finishes. The delay between click and visual response is the INP.
Inefficient event handlers. Event listeners that trigger heavy computation, large DOM updates, or cascading style recalculations in response to user input directly inflate INP.
Third-party scripts. Analytics tools, advertising scripts, chat widgets, and other third-party JavaScript often run on the main thread and contribute to long tasks that inflate INP. Third-party scripts are one of the most common INP culprits and the hardest to control because you do not own the code.
Excessive DOM size. Very large DOM trees (pages with thousands of elements) slow down style calculations and layout operations triggered by interactions, inflating INP.
How to Fix INP
INP is the most technically challenging Core Web Vital to fix. Unlike LCP (which is primarily an asset optimisation problem) or CLS (which is primarily a CSS and layout problem), INP requires changes to JavaScript execution patterns.
Break up long tasks:
Use setTimeout, requestAnimationFrame, or the Scheduler API to break up long JavaScript tasks into smaller chunks. By inserting points where the browser can process pending user input between chunks, INP is reduced even when the total computation remains the same.
Defer non-critical JavaScript:
Work that does not need to happen immediately in response to user input should be deferred. Analytics events, non-critical state updates, and pre-fetching operations are examples of work that can be scheduled outside the critical user interaction response.
Audit third-party scripts:
Use Chrome DevTools Performance panel or Web Almanac third-party impact data to identify which third-party scripts are running long tasks. For non-essential third-party scripts, consider loading them with defer, async, or after user interaction. For essential scripts, evaluate whether less performance-impactful alternatives exist.
Use web workers for heavy computation:
JavaScript that performs intensive computation (data processing, image manipulation, encryption) can be moved to web workers, which run on a separate thread from the main browser thread. This removes the computation from the path that blocks user input responses.
Reduce DOM size:
Aim to keep the total DOM element count below 1,400 nodes for most pages. Very large DOMs slow every browser operation that touches the DOM tree, including the style and layout calculations triggered by user interactions.
CLS: Cumulative Layout Shift
What CLS Measures
CLS — a measure of how much the visible content of a page moves unexpectedly after initial rendering, during the loading process or in response to dynamic content.
CLS is scored on a scale from 0 (no layout shift) to infinity (severe, continuous shifting). The score is calculated from the fraction of the viewport affected by the shift multiplied by the fraction of the distance content moved.
Google’s threshold: CLS under 0.1 is “good.” CLS between 0.1 and 0.25 “needs improvement.” CLS over 0.25 is “poor.”
According to the 2025 Web Almanac, 81% of mobile pages now achieve a good CLS score, making it the most commonly passed Core Web Vital. Despite this, CLS failures remain a significant issue on the 19% of pages that fail, particularly on pages with heavy advertising, dynamic content, or web fonts.
What Causes Poor CLS
Images without explicit dimensions. When an image is loading, the browser does not know how much space to reserve for it unless explicit width and height attributes are specified. When the image loads, it pushes surrounding content down, creating a layout shift. This was historically the most common CLS cause.
Dynamically injected content above existing content. Banners, cookie consent notices, chat widgets, advertisements, and personalised content blocks that are injected into the page after initial render push existing content down, causing layout shifts. Any content injected above the fold after initial load is a CLS risk.
Web fonts with visible text flash. Fonts that load asynchronously cause text to rerender when the web font replaces the fallback system font. If the web font is a different size or weight than the fallback, text reflows and causes CLS.
Animations and transitions that affect layout. CSS animations that change properties like width, height, margin, or padding trigger layout recalculations that cause CLS. Animations should use transform and opacity instead, which do not trigger layout recalculation.
How to Fix CLS
Add explicit dimensions to all images and media:
Add width and height attributes to all img elements. Modern CSS then maintains the correct aspect ratio when images are responsively sized. This simple change eliminates the most common CLS source.
html
<img src="hero.webp" width="1200" height="600" alt="Description">Reserve space for dynamic content:
If a banner, advertisement, or cookie notice will appear above existing content, reserve the space for it in the initial layout using CSS min-height or an empty placeholder div. The content appearing in pre-reserved space does not cause a layout shift.
Optimise web font loading:
Use font-display: swap in CSS font-face declarations. This causes the browser to display text immediately using the fallback font and swap to the web font when it loads. While a flash of unstyled text (FOUT) may occur, the resulting CLS is lower than the alternative of invisible text that reflows when the font loads.
Preload critical web fonts using <link rel="preload" as="font"> to reduce the time between initial render and font load, minimising the FOUT duration.
Use CSS transform for animations:
Animations that cause CLS should be refactored to use CSS transform: translate() and opacity instead of layout-affecting properties. Transforms are composited by the browser’s graphics layer and do not trigger layout recalculation.
Field Data vs Lab Data: What Actually Affects Rankings
One of the most important distinctions in Core Web Vitals is between field data and lab data. Only field data affects rankings.
Field data — measurements from real users accessing your actual pages on their actual devices and connections. Collected by Chrome and reported through the Chrome User Experience Report (CrUX). Shown in Google Search Console’s Core Web Vitals report and in the “Discover what real users experience” section of PageSpeed Insights.
Lab data — simulated measurements under controlled conditions. Generated by Lighthouse, the Lighthouse-based measurements in PageSpeed Insights, and similar synthetic testing tools. Useful for diagnosis but does not affect rankings.
The distinction matters in several scenarios:
A page can have excellent lab data scores but poor field data scores if real-world users are on slower devices or connections than the lab simulation assumes.
A page can have adequate field data scores but poor lab data scores if the lab simulation is particularly conservative or uses different throttling parameters.
Google’s ranking signals use field data. When optimising for rankings, field data in Search Console is the authoritative source. Lab data is a diagnostic tool for identifying what to fix.
If a page has insufficient real-user data (because it does not receive enough Chrome traffic), CrUX data may not be available for that specific URL. Google falls back to the domain-level CrUX data in this case.
Measuring Core Web Vitals: Tools and Workflow
Google Search Console (Core Web Vitals Report)
The most important monitoring tool. The Core Web Vitals report in Search Console shows field data for all pages on your site, grouped by performance status (Good, Needs Improvement, Poor) for both mobile and desktop. It also shows which specific metric is failing on which groups of pages.
Review this report monthly. Regressions (pages moving from “Good” to “Needs Improvement” following a site update or third-party script change) should be diagnosed and fixed promptly.
Google PageSpeed Insights
The most accessible diagnostic tool. Enter any URL and receive both field data (if CrUX data is available for that URL) and lab data, along with specific recommended improvements ranked by their estimated impact.
Use PageSpeed Insights as the first diagnostic step when a page fails Core Web Vitals in Search Console. The “Opportunities” and “Diagnostics” sections identify specific elements causing failures.
Chrome DevTools Performance Panel
For detailed INP and LCP diagnosis that PageSpeed Insights does not fully resolve, Chrome DevTools Performance panel provides granular analysis: a timeline of all network requests, JavaScript execution, layout operations, and paint events. Identifies which specific JavaScript tasks are causing long task warnings and which resources are delaying LCP.
WebPageTest
More detailed than PageSpeed Insights for complex performance issues. WebPageTest provides a filmstrip view (showing how the page appears at each second of loading), waterfall diagrams of all network requests, and the ability to run tests from specific geographic locations and connection speeds.
DebugBear
A continuous Core Web Vitals monitoring tool that tracks field and lab data over time and alerts when regressions occur. Particularly useful for sites that deploy frequently and need to catch performance regressions before they affect rankings.
Core Web Vitals for Different Platforms
WordPress
WordPress sites frequently fail Core Web Vitals due to plugin bloat (multiple plugins each adding JavaScript and CSS) and shared hosting limitations.
Key WordPress optimisations:
- Page caching: WP Rocket, W3 Total Cache, or LiteSpeed Cache reduce TTFB dramatically
- Image optimisation: Shortpixel, Imagify, or WebP Express convert images to WebP automatically
- JavaScript optimisation: defer non-critical scripts using plugin settings or code
- CDN: Cloudflare (free plan is sufficient for most sites) reduces LCP for international users
- Database cleanup: slow database queries increase TTFB on dynamic pages
Avoid page builders (Elementor, Divi, WPBakery) where possible, or configure them to output minimal CSS and JavaScript. Page builders are a frequent source of render-blocking resources and large DOM sizes.
Shopify
Shopify handles hosting and infrastructure, so TTFB is generally good. The most common Shopify CWV failures are:
- Third-party app scripts inflating INP and LCP
- Unoptimised product and collection images causing LCP failures
- App-injected content causing CLS
Shopify’s 2024 to 2026 performance improvements (storefront rendering, image CDN, and app sandboxing) have significantly raised baseline performance. Stores built on Shopify 2.0 themes with minimal installed apps typically achieve good CWV scores without significant additional optimisation.
Custom/Next.js/React Sites
JavaScript-heavy sites built with React, Next.js, or similar frameworks frequently have INP issues related to hydration — the process of attaching JavaScript event handlers to server-rendered HTML. Heavy hydration on page load can cause long tasks that inflate INP on initial page loads.
Next.js’s App Router and server components reduce client-side JavaScript significantly compared to earlier React patterns. Sites still using client-side rendering for critical interactions should consider migrating to server components or Partial Hydration patterns.
Common Core Web Vitals Mistakes
Optimising lab scores instead of field scores. PageSpeed Insights lab data and field data can disagree significantly. Improvements that dramatically raise lab scores may have minimal impact on field data if the bottleneck is in real-world conditions (device capability, connection speed) rather than the specific optimisation tested.
Applying lazy loading to the LCP element. This is perhaps the most counterproductive single mistake in LCP optimisation. Lazy loading defers image loading until the image approaches the viewport. For the LCP element — the above-the-fold hero image — this deliberately delays the most important content. Apply lazy loading only to below-the-fold images.
Fixing CLS on desktop while ignoring mobile. Google uses mobile-first indexing. CWV scores on mobile are what affect rankings. A page that passes CWV on desktop but fails on mobile receives the mobile score for ranking purposes.
Ignoring third-party script impact on INP. Third-party scripts are a leading cause of INP failures. They run JavaScript on the main thread outside your direct control. Auditing which third-party scripts are contributing to long tasks is essential before attempting other INP fixes.
Not monitoring after changes. Core Web Vitals can regress after site updates, new plugin additions, or third-party script changes. Without ongoing monitoring, regressions go undetected until traffic or rankings decline noticeably.
❓ Frequently Asked Questions
Will improving Core Web Vitals guarantee better rankings?
No. Core Web Vitals are a ranking factor, not the ranking factor. Improving from “poor” to “good” typically produces approximately 1 to 2 position improvements in competitive keyword spaces. Content quality, backlinks, and relevance remain the primary ranking signals. Core Web Vitals affect rankings most clearly as a tiebreaker between pages that are otherwise evenly matched.
My PageSpeed Insights score is high but Core Web Vitals still shows “Needs Improvement” in Search Console. Why?
PageSpeed Insights lab data and CrUX field data can differ significantly. Lab data simulates a specific device and connection. Field data reflects real users across all their actual devices and connections. Real users may be on slower mobile devices or lower-bandwidth connections than the lab simulation. Focus on the field data in Search Console for ranking purposes.
How long does it take for Core Web Vitals improvements to affect rankings?
CrUX data (which Google uses for rankings) is updated on a rolling 28-day window. Improvements made today will not be fully reflected in the ranking signal for at least 28 days as the data updates. After that, ranking changes typically follow within a few weeks as Google re-evaluates affected pages.
Is CLS still worth optimising given 81% of pages now pass?
Yes. The 19% of pages that fail CLS still face a ranking disadvantage relative to the 81% that pass. More importantly, on pages with heavy advertising, dynamic content, or recently added features, CLS failures are common even on sites that previously passed. CLS should be monitored continuously, not fixed once and forgotten.
What is the hardest Core Web Vital to fix?
INP is almost universally considered the hardest Core Web Vital to fix. It requires changes to JavaScript execution architecture, not just asset compression or CSS changes. Many developers find INP diagnosis and remediation significantly more complex than LCP or CLS work.
Summary
Core Web Vitals are three measurable, actionable page experience signals that Google uses as confirmed ranking factors: LCP (loading speed, target under 2.5 seconds), INP (interactivity, target under 200 milliseconds), and CLS (visual stability, target under 0.1).
The ranking impact is real but contextual: approximately 1 to 2 position improvements in competitive spaces where content and authority are otherwise comparable. The business impact is often more compelling: moving from “poor” to “good” on all three metrics produces 11 to 19% conversion rate improvements.
The most common cause of each failure:
- LCP: Unoptimised images (especially the LCP element itself) and slow server response times
- INP: JavaScript executing long tasks on the main thread, especially from third-party scripts
- CLS: Images without explicit dimensions and dynamically injected above-fold content
Field data from CrUX (shown in Search Console) is what affects rankings. Lab data (PageSpeed Insights, Lighthouse) is a diagnostic tool. Optimise for field data improvement, use lab data to identify what to fix.
Monitor continuously. Core Web Vitals can regress after site updates. Monthly review of Search Console’s Core Web Vitals report and alerting on regressions should be standard practice for any site where performance matters to business outcomes.
Core Web Vitals Optimisation Checklist
Use this checklist before and after any site change that might affect performance.
LCP Checklist
- LCP element identified (use PageSpeed Insights or Chrome DevTools)
- LCP element is an image: converted to WebP or AVIF
- LCP image is correctly sized for its display dimensions
- LCP image has fetchpriority=”high” attribute
- LCP image does NOT have loading=”lazy” attribute
- LCP image is preloaded with
<link rel="preload" as="image"> - TTFB under 600 milliseconds (verified in PageSpeed Insights)
- CDN is implemented for static assets and ideally full-page delivery
- Critical CSS is inlined in the HTML head
- Non-critical JavaScript uses defer or async attributes
- Render-blocking stylesheets are identified and addressed
INP Checklist
- Chrome DevTools Performance panel used to identify long tasks (over 50ms)
- Third-party scripts audited for main thread impact
- Non-critical third-party scripts deferred until after page load or after user interaction
- Event handlers do not perform heavy computation synchronously
- Heavy computation moved to web workers where feasible
- Total DOM node count under 1,400 elements
- No long tasks blocking critical interaction response paths
CLS Checklist
- All images have explicit width and height attributes
- All embeds (video, maps, iframes) have explicit dimensions or aspect-ratio CSS
- No above-fold content is dynamically injected without pre-reserved space
- Cookie notices, banners, and notifications load below the fold or in reserved space
- Web fonts use font-display: swap or font-display: optional
- Critical web fonts are preloaded
- Animations use CSS transform and opacity (not layout-affecting properties)
- CLS score verified on mobile device (mobile field data is what affects rankings)
Monitoring Checklist
- Google Search Console Core Web Vitals report reviewed monthly
- Alerts configured for performance regressions after deployments
- CrUX field data compared against lab data for significant discrepancies
- Third-party script impact audited quarterly
- Platform-specific tools configured (DebugBear, SpeedCurve, or similar)
The Business Case for Core Web Vitals Investment
For SEO teams making the case to development and engineering resources for Core Web Vitals improvements, the business case is often more persuasive than the ranking case.
Conversion rate: A 1-second improvement in load time can increase conversions by 7%. For most businesses, the revenue impact of this improvement exceeds the cost of the engineering work required to achieve it within the first few months.
Bounce rate: Pages loading in under 2 seconds show 9% bounce rates. Pages loading in 5 seconds or more show 38% bounce rates. The organic traffic lost to bounce rates from poorly performing pages is traffic that has already been paid for through SEO investment. Keeping visitors on the page once they arrive is the highest-leverage application of that existing traffic.
User satisfaction and return visits: Pages that load quickly and respond smoothly to interaction produce higher user satisfaction scores and are more likely to be revisited directly. Brand perception correlates with digital experience quality in ways that compound over time.
Ads efficiency: For sites running paid search or display advertising, poor page performance reduces Quality Scores in Google Ads (which directly affects CPC and ad position). The same landing page performance improvements that improve organic rankings also reduce paid traffic costs.
The combined case — ranking improvement, conversion rate lift, bounce rate reduction, and advertising efficiency improvement — makes Core Web Vitals one of the clearest cross-functional investments a digital team can make. The work is primarily technical, but the benefits extend well beyond SEO.